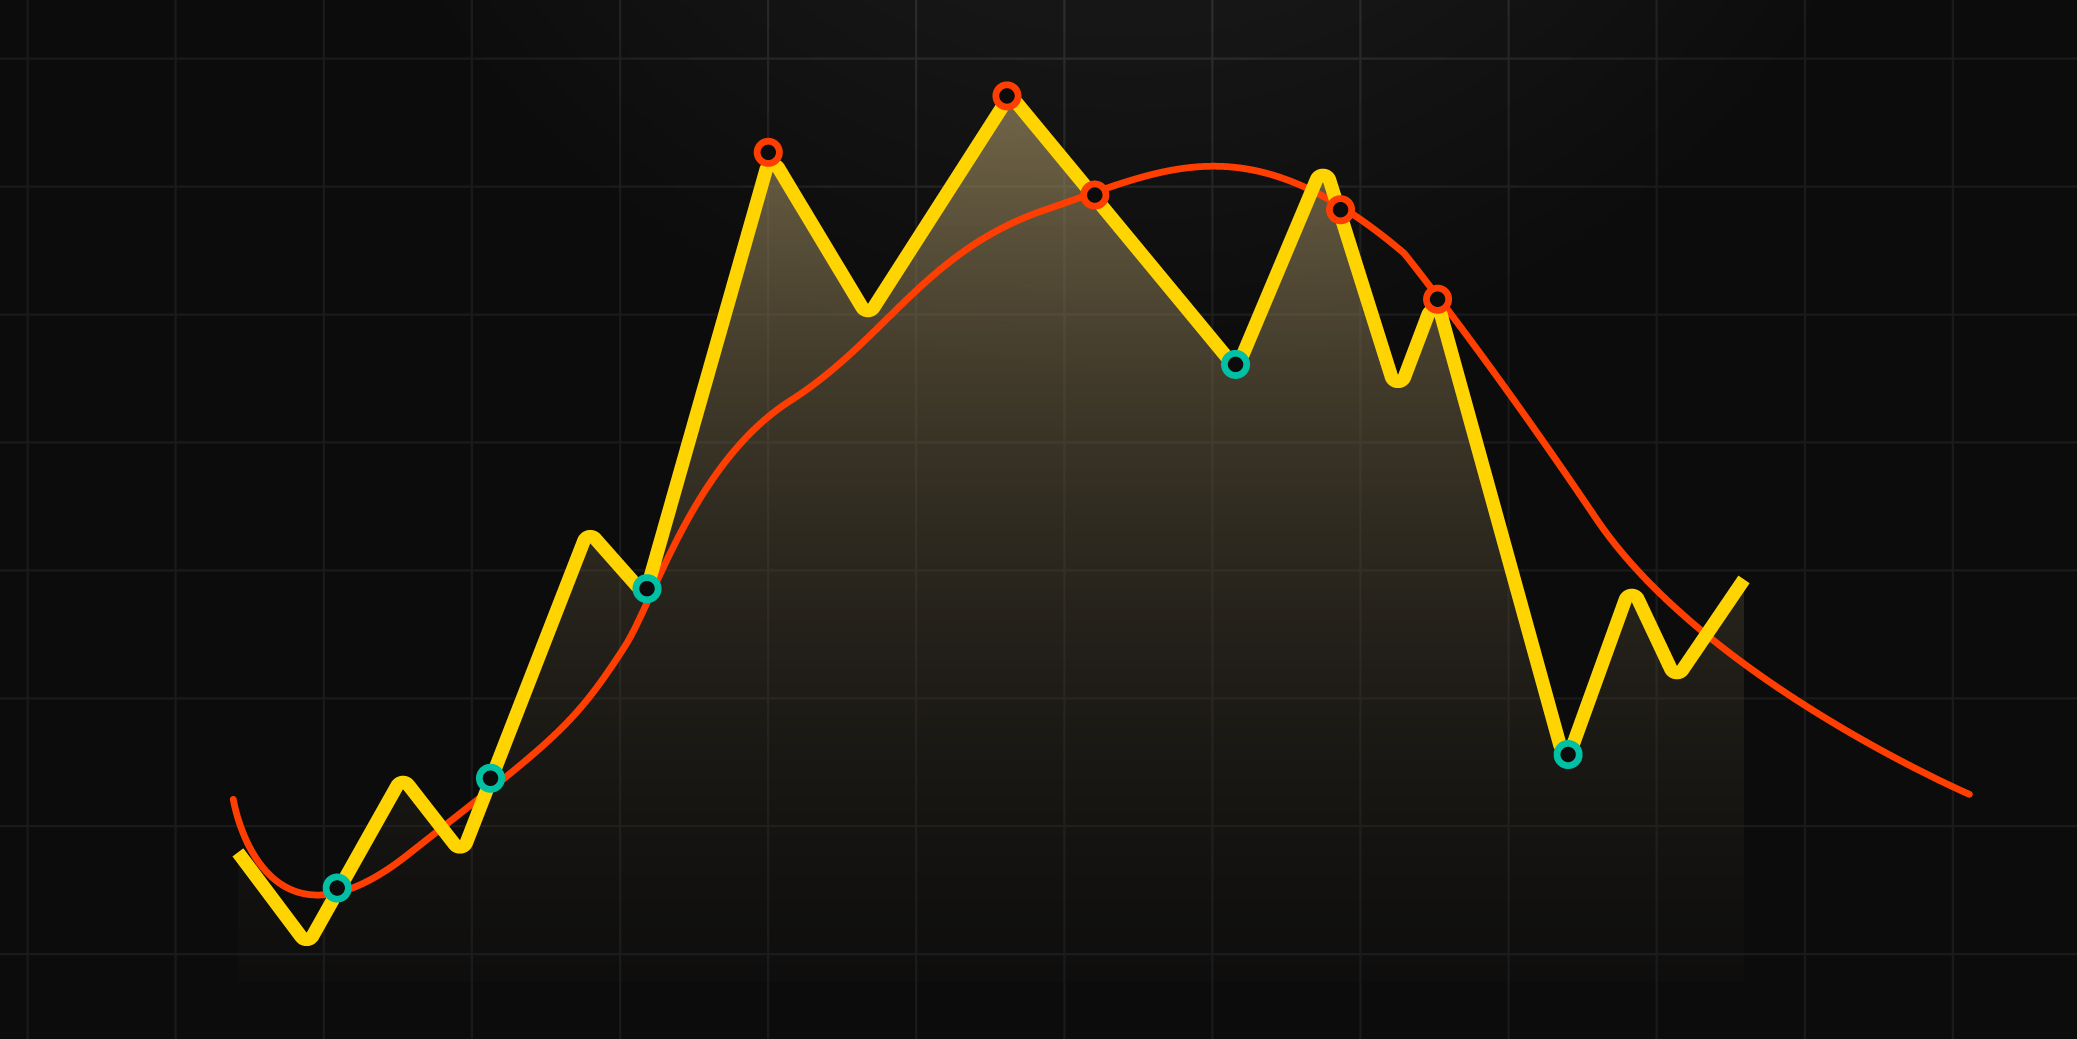
MA stands for Moving Average. It is a widely used technical analysis indicator that helps identify trends, smooth out price fluctuations, and determine potential support and resistance levels.
Advantages of MA:
1. MA provides a clear visual representation of the average price over a specific period, allowing traders to identify the direction of the trend.
2. It helps filter out noise and highlight the underlying price movement, making it easier to spot key trading opportunities.
3. MA can be customized to different timeframes, catering to short-term and long-term analysis needs.
Disadvantages of MA:
1. MA may lag behind during periods of high volatility or sudden price reversals, leading to delayed signals.
2. It may generate false signals in ranging markets or during periods of choppy price action.
3. MA alone may not provide sufficient information for precise entry and exit points, often requiring additional indicators or analysis techniques.
To use the MA indicator, follow these steps:
1. Choose the desired timeframe and select the number of periods for the moving average calculation (e.g., 20-day MA, 50-day MA).
2. Plot the MA line on a chart, which represents the average closing price over the specified number of periods.
3. Identify the direction of the trend based on the slope of the MA line (upward for an uptrend, downward for a downtrend).
4. Use MA crossovers, such as when a shorter-term MA crosses above or below a longer-term MA, as potential buy/sell signals.
5. Consider using the MA as dynamic support/resistance levels, where prices tend to bounce off or break through.
RSI and MA are different indicators with distinct purposes. RSI measures the strength and momentum of price movements, while MA focuses on identifying trends and smoothing out price fluctuations. They can be used together to confirm signals and enhance trading strategies, but they each have their own unique applications and interpretations.