The KDJ indicator is a technical analysis tool used to identify potential trend reversals and overbought/oversold conditions in financial markets, particularly in stocks and futures. It is based on the movements of price and is similar to the stochastic oscillator.
Advantages:
1. Helps identify overbought and oversold conditions
2. Can be used to confirm trend strength
3. Provides clear buy and sell signals
Disadvantages:
1. Can produce false signals in ranging markets
2. Lagging indicator, which means it may not provide timely signals in fast-moving markets
3. Interpretation can be subjective
How to Use the KDJ Indicator:
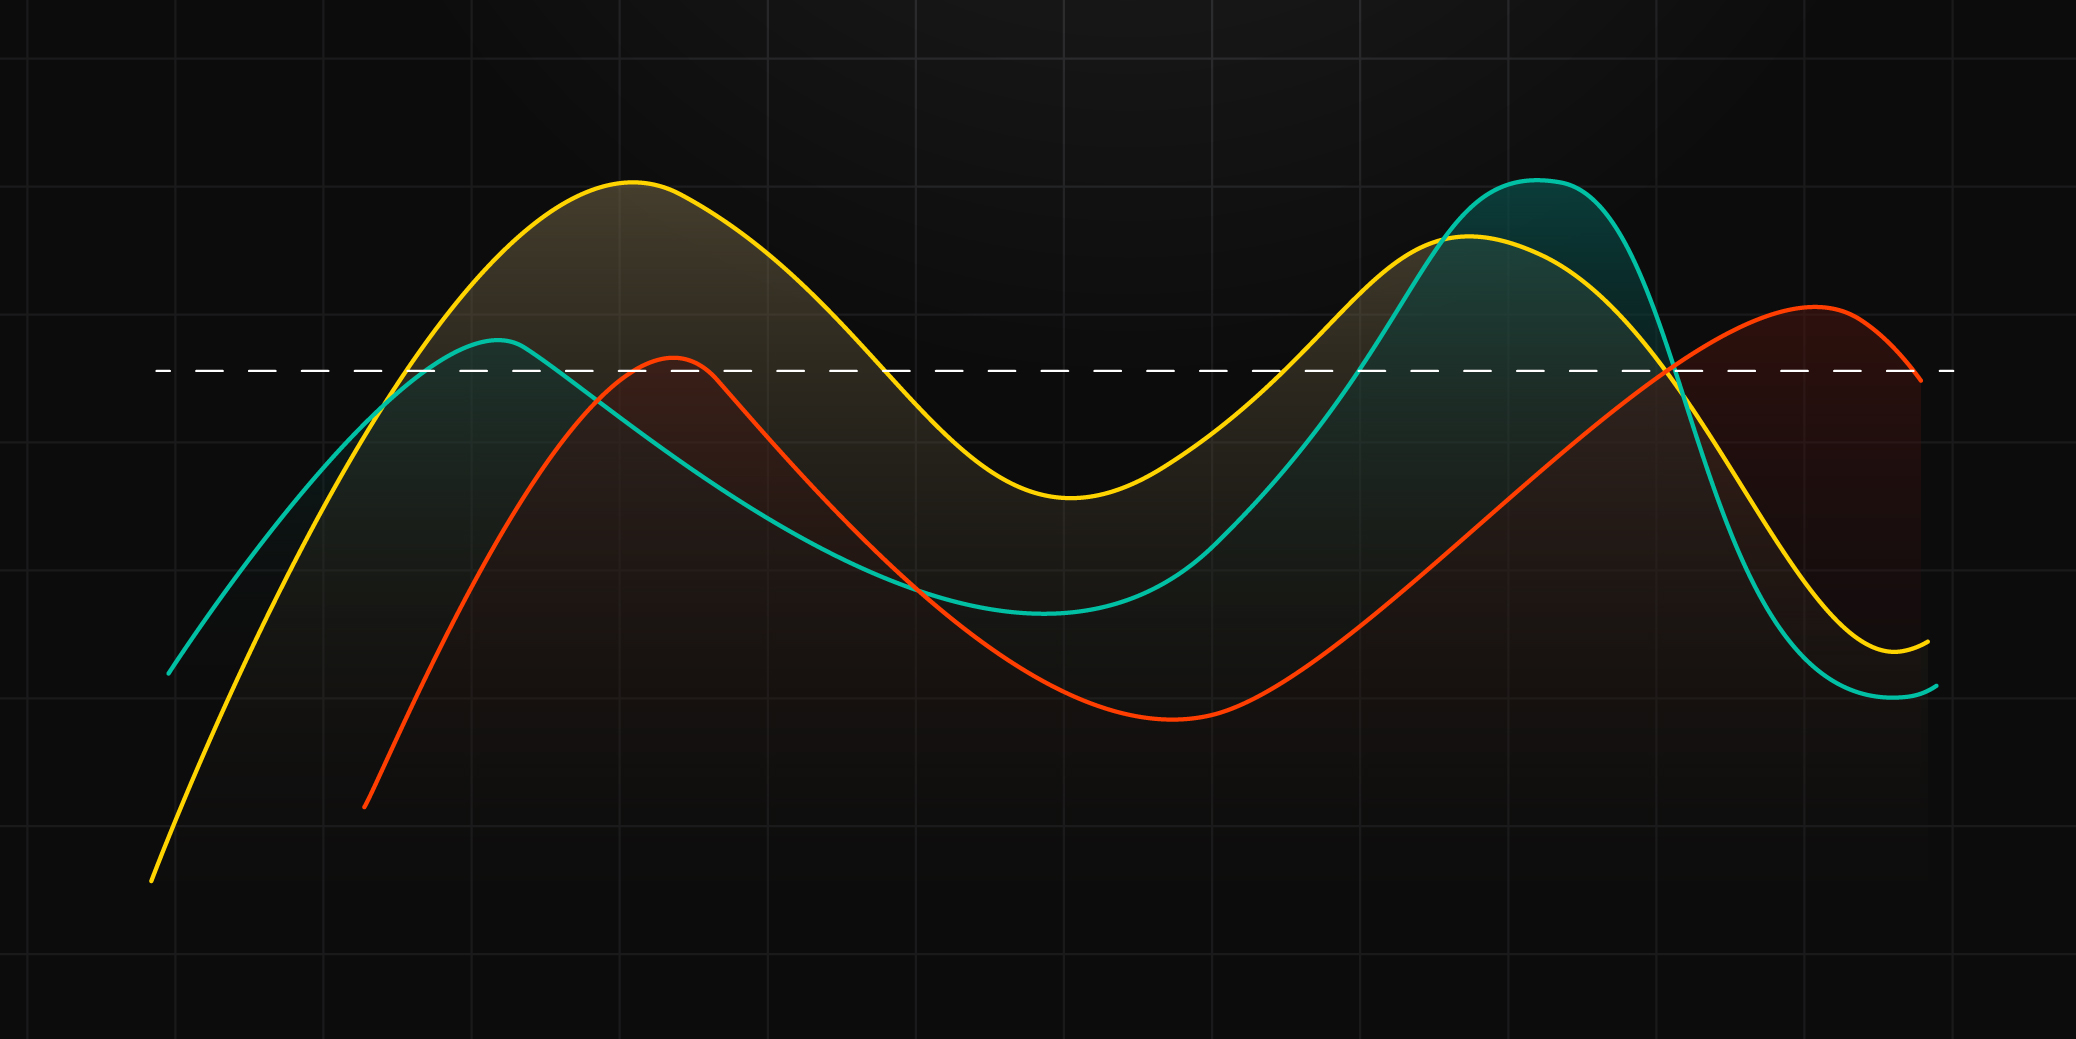
1. Calculate the KDJ values: The KDJ indicator consists of three lines – K, D, and J – which are derived from the highest high and lowest low prices over a specified period.
2. Interpret the KDJ lines:
a. When the K line crosses above the D line, it generates a buy signal.
b. When the K line crosses below the D line, it generates a sell signal.
3. Identify overbought and oversold conditions:
a. When the K line crosses above 80, it indicates overbought conditions.
b. When the K line crosses below 20, it indicates oversold conditions.
It's important to use the KDJ indicator in conjunction with other technical analysis tools to confirm signals and avoid relying solely on its readings.